Road Accidents Report
- Tech Stack: Power BI, Power query
- Github URL: Click here
- Interactive Dashboard: Click here
1. Introduction
This project focused on analyzing road accidents data for the years 2021 and 2022. The main objective was to create an interactive Power BI dashboard that provides insights into road accident trends, casualties, accident severity, vehicle types, and other relevant factors. This dashboard aims to help stakeholders gain a comprehensive understanding of road safety performance and identify areas that require attention and improvement.
2. Problem Statement
Road accidents are a significant public safety concern, and understanding the patterns and contributing factors behind accidents is crucial for devising effective measures to reduce casualties and improve road safety. The problem addressed in this project was to analyze and visualize the road accident data to answer the following key questions:
- Which vehicle types were involved in the highest number of accidents and casualties?
- What were the trends in road accidents and casualties on a monthly basis?
- How did the number of casualties vary across different road types?
- What is the distribution of casualties based on accident severity?
- How did the casualties differ between urban and rural areas and in different light conditions?
- Which day of the week witnessed the highest and lowest number of accidents?
3. Data wrangling and Preprocessing
To ensure the accuracy and usability of the road accidents data, several data transformation steps were performed:
Handling Missing Values: Missing values were identified and imputed.
Removing Duplicates: Duplicated records were removed to avoid inaccuracies in the analysis.
Data Modelling: The dataset was structured and modeled in a way that allowed for easy integration into the Power BI dashboard. Relevant data columns were selected and organized to support various visualizations.

4. Data Analysis and Visualization
The data analysis and visualization were carried out through an interactive Power BI dashboard. The dashboard incorporated various KPIs and insightful graphs to present the findings effectively:
4.1 Key Performance Indicators (KPIs):
- Total Casualties and Total Accidents for Current Year and total Growth from Previous Year.
- Total Casualties By Accident Severity for Current Year and Growth from Previous Year.
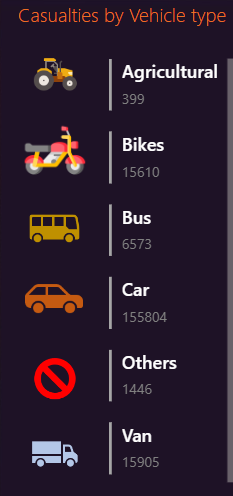
- Total Casualties with Respect to Vehicle Type for Current Year.

The overall number of casualties and accidents decreased in 2022 compared to 2021, indicating a positive trend in road safety.

The KPI above presents the total number of casualties attributed to different vehicle types for the current year. Cars have the highest involvement in accidents, highlighting the importance of promoting safer driving practices and vehicle safety measures.
4.2 Visualizations:
a. Monthly Trend of Casualties for Current Year and Previous Year

The chart above illustrates the monthly trend of casualties for 2021 and 2022. It shows that casualties decreased in 2022 compared to the previous year, indicating improved road safety measures.
b. Comparison of Casualties in Urban\Rural Areas and by Light Conditions


According the above visuals; i. Urban areas experienced a higher number of casualties, suggesting the need for targeted safety initiatives in city settings.
ii. More accidents occur during the day, indicating a potential focus on improving safety during nighttime hours.
c. Casualties by Day of the Week:

The chart above presents the number of casualties reported on each day of the week. Saturdays consistently witness the highest number of accidents, suggesting targeted awareness campaigns on weekends.
d. Casualties by road type:

The chart above displays the distribution of casualties across different road types. Single Carriageways have the highest number of casualties, highlighting the need for better road infrastructure and safety measures on these roads.
5. Recommendations
Based on the analysis, the following recommendations are proposed to further enhance road safety:
Final Dashboard Report

Thank you!☺️